

Website heatmaps
Learn how your users behave on your site!
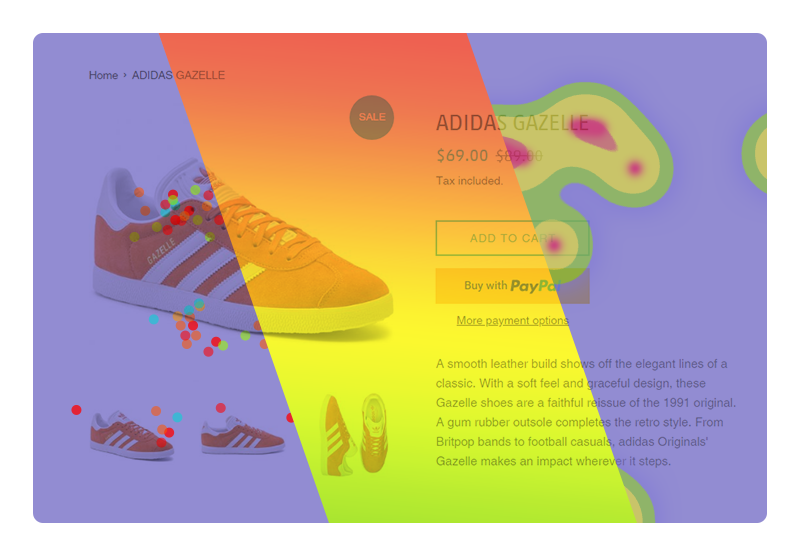
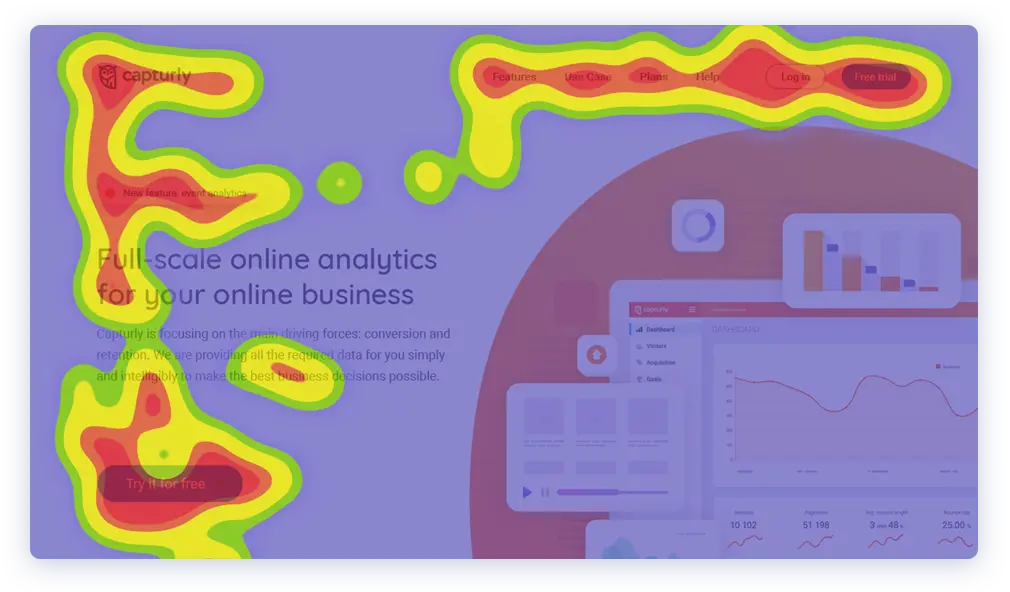
With Capturly's website heatmap tool, you can visualize user interactions such as clicks, taps, and scrolls on a website. Heat maps use a cold-to-hot temperature scale to effectively illustrate which parts of the webpage attract the most or the least attention from users.


If You Want to Know...

What are the hotspots of your site?
Heatmaps are the perfect tools to assess user engagement and guide you in arranging website content to favor high conversion. Using a color scale from cold to hot, heatmaps reveal the most attractive parts of your page as well as the areas that need improvement.

Why your CTAs aren't hitting the mark?
Heatmaps quickly turn visitors into testers. Evaluate your CTAs, understand why some don't resonate, and improve them. Is your CTA too low, or does a color change help? Use heatmap analytics to answer these and optimize your site for the best results.

Why your visitors aren't converting?
Uncover their pain points, whether they lie in your checkout page, your CTAs, or elsewhere on your site. Heatmaps can show areas that demand additional refinement. Rely on real user interactions to craft a site primed for high conversions.
Capturly Heatmap Types
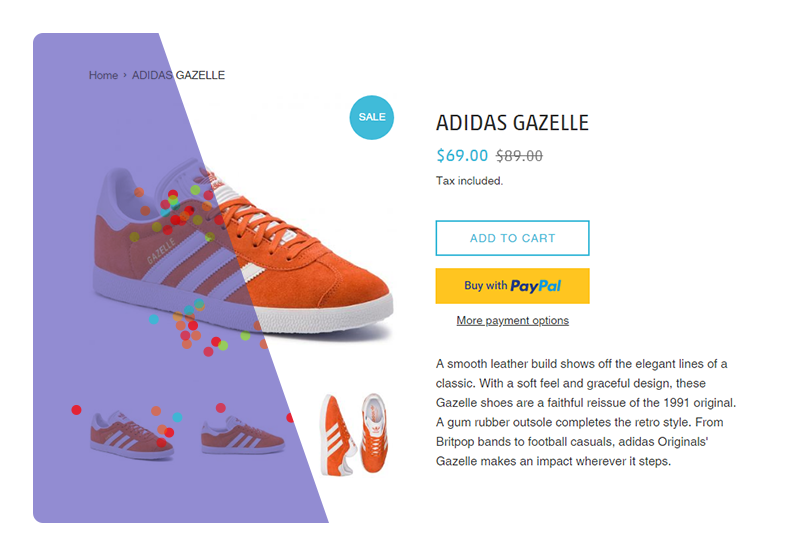
Click heatmap
Are visitors discovering and engaging with every button on your website?
Clicks are among the most potent indicators of interest. Click heatmaps provide you with an aggregated view of every click location on your page. Determine which elements on your site garner the most attention and identify potential distractions or misleading features! Additionally, employ real user tests to compare engagement before and after implementing changes.
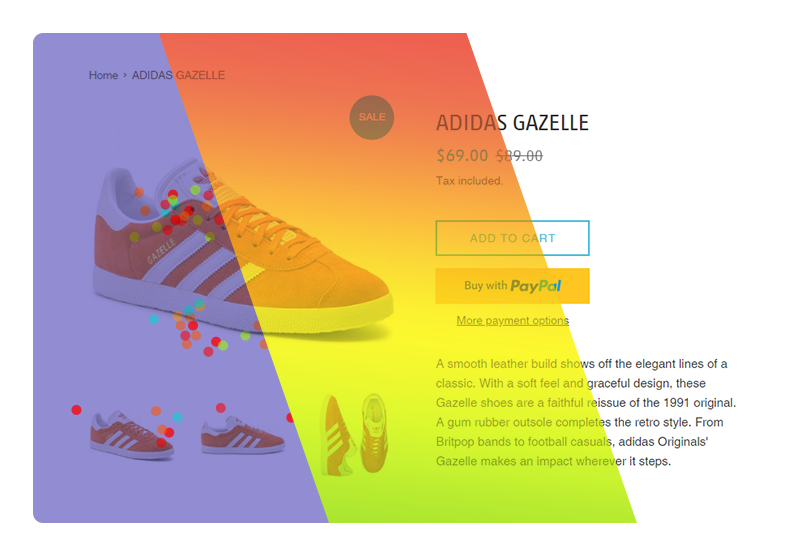
Scroll heatmap
Are you curious about how far your visitors scroll on your website?
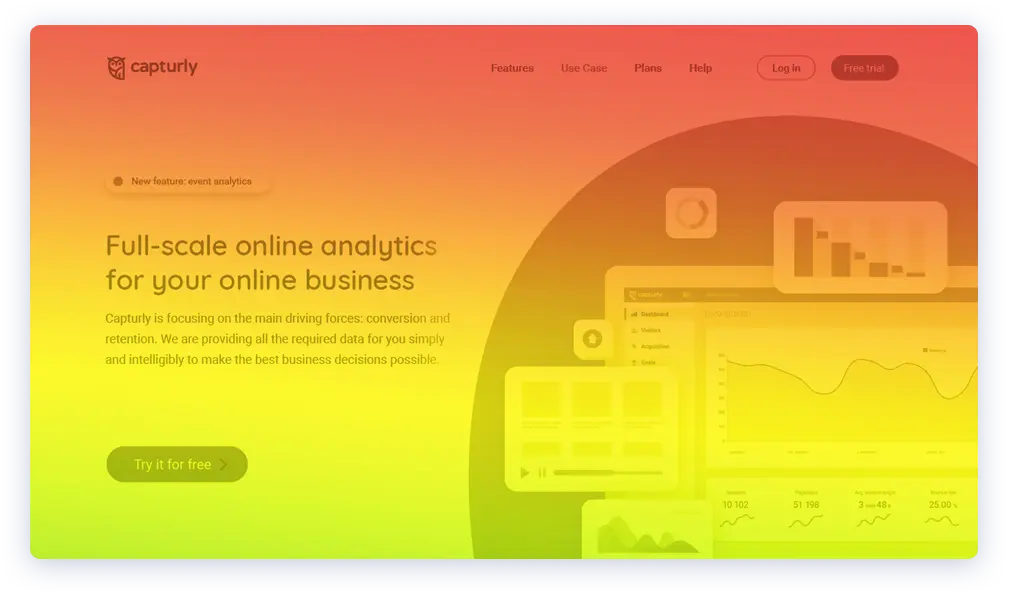
Scroll heatmaps enable you to effortlessly determine the extent of your page viewed by visitors and establish the proportion who depart without taking a desired action. For instance, if your CTA is positioned lower on your page, it may not align with visitor expectations. The color changes on scroll heatmaps indicate where a majority of your visitors lose interest.
Segment heatmap
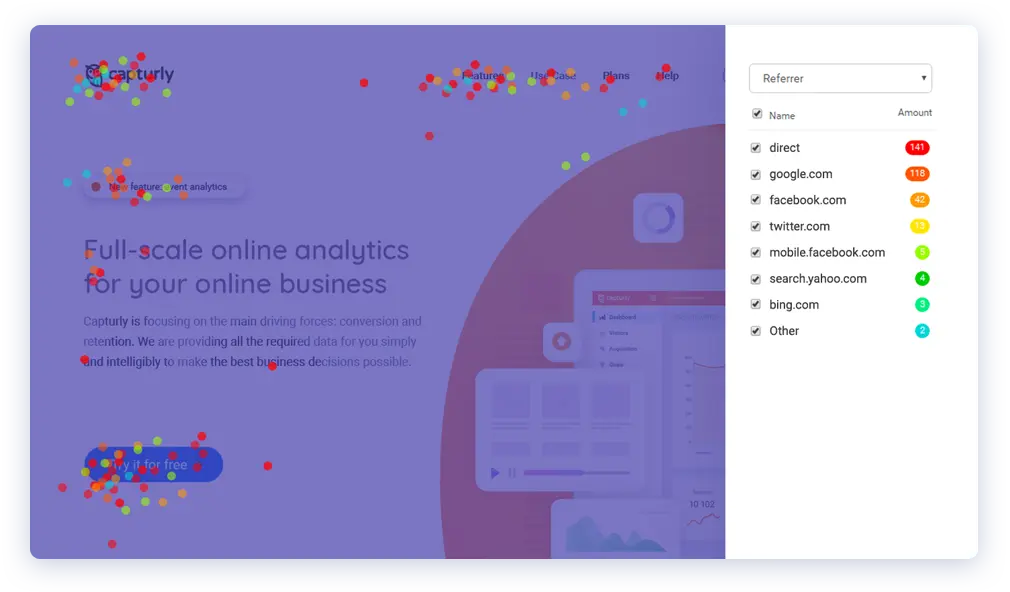
Are you aware of which referrers bring the most active visitors to your site?
Do you wonder how returning visitors interact differently with your site compared to new visitors, or if visitor behavior varies depending on the source? Segment heatmaps allow you to differentiate between users based on numerous attributes. Whether focusing on operating systems, devices, or browsers, you can pinpoint issues unique to each one. Each segment is color-coded for clarity and quick comprehension.
Read More About Heatmaps

![6+1 Best WordPress Heatmap Plugins for Free [2023]](/img/analytics/features/blog/heatmap-2.webp)

Want to Discover What Makes
Capturly's Heatmap Offer So Unique?

No manual setups needed
We understand the value of your time. With Capturly, there's no need for manual setup. Furthermore, to streamline your workflow, all your heatmaps are conveniently organized in one location!

Unlimited heatmaps in every plan
Interested in observing where users click and what they miss on each page of your website? Rest assured! Our plans, including the free one, offer unlimited heatmaps. Furthermore, we refrain from data sampling, ensuring you have complete access to every bit of data you paid for!
3-in-1 heatmap package
Unlock comprehensive website analysis with Capturly's 3-in-1 heatmap package. Comprising click heatmaps, scroll heatmaps, and segment heatmaps, we cater to diverse analytics needs. Detect unexpected clicks, examine scrolling patterns of visitors on your pages, analyze user behavior based on traffic sources, and much more!


Expert's tip
Begin your heatmap analysis by defining the research question and its aim. Use Capturly to filter for relevant pages; you can narrow down your research to specific URLs, device types, referrals, operating systems, and browsers based on your goals. Always test your hypotheses and revisit your heatmap analysis periodically.
Uncover Hidden User Patterns with Capturly's Heatmaps
Get Started for Free and Improve Your Conversions!
Unlimited heatmaps

Automatic data collection
No manual setups

GDPR- & CCPA-compliant
User Story


Frequently asked questions
A website heatmap (or heat map) is a visual representation of user behavior on a website based on interactions such as clicks, taps, and scrolls.
Heatmaps are used to understand user behavior, which can help you provide a better user experience, increase conversion rates, improve content strategy, and conduct A/B testing.
With Capturly, you don't have to worry about creating heatmaps! We will do the work for you. We automatically generate a heatmap for every URL you have.
Yes! We track (and show) every user's clicks, scrolls, and taps on heatmaps, without any data sampling.
Yes, we generate heatmaps for each page you have, without any limitations on the number of URLs.
We provide real-time data updates, so you will always see the most recent clicks on heatmaps.
It depends on your preference. By default, Capturly will show you the heatmap for each tracked URL. However, you can turn off the default setting, and we will ignore the parameters when generating heatmaps.
Use filters to narrow down the results. Check your most important pages, such as landing pages or the checkout page. Compare heatmap results on mobile and desktop, as user behavior may differ depending on the device type.
Yes, you can! Every tap is counted as a click on the heatmap.

